Using tweets to predict sentiment popularity of swedish political parties
by bernt & torsten
Recently attended a presentation by Google on the Machine Learning APIs, and how you could use Google BigQuery to collect tweets and use the Natural Language API to understand the sentiment of the data.
I got some tips for articles to read on the topic, so a big thanks to Sara Robinson: Comparing tweets about Trump & Hillary with natural language processing and Lee Boonstra -Forecast the Dutch Elections based on social media presence.
To replicate what Sara and Lee had done, we need to use some tools to make a prediction on the twitter sentiment amongst the Swedish parties.
The tools I used:
- Twitter Streaming API: get all the tweets – The application code is written in JavaScript for Node.js.
- Cloud Natural Language API: parse the tweets & get syntactic data
- Cloud Translate API – Natural Language API does not support Swedish, it needs to translate from Swedish to English.
- BigQuery: analyze the tweet syntax data
- Data Studio – to visualize the data
What I’m going to do and show you, is how to pull in tweets that are posted by Swedish Political Parties, I will do a sentiment analysis before storing the data in BigQuery, then I will use some queries to create a dashboard in Data Studio.

What you need to follow
- Laptop – we are going to run this from a local machine
- Node JS – you need to install it on your local machine
- Node Express framework ( $ npm install express –save)
- A Google Cloud Platform (GCP) Account (or create a free trial account)
Getting Started
To start, open the GCP Console, and create a new project.

Go to: https://console.cloud.google.com and click: Create new project, and enter an easy-to-remember project name, which will be used as the project id.
You need to remember the project name as you will use it later. To make it easy, you can download this repository that has the code for the application.
Then you need to
$ cd GCP-BigQuery-Svensk-Politik

$ npm install
Go back to the GCP console and click the hamburger menu icon, and select:

IAM > Service Accounts > Create Service Account
Service account name: tweetapp
Role: Project > Owner
Click: Create > Close
Click the button with the three dots next to the tweet app, to open an extra menu.
Select: Create key. Choose JSON. Click Create.
A key has been saved to your local machine. Rename this -.json file, as: cloudkey.json, and copy it into your GCP-BigQuery-Svensk-Politik app folder.
Also, create a .env file in the root of your app folder. It should have the following contents:
GCLOUD_PROJECT=
GCLOUD_KEY_FILE=./cloudkey.json
The Twitter Streaming APIs give developers low latency access to Twitter’s global stream of Tweet data. A streaming client that pushes tweets without any overhead associated with polling a REST endpoint.
We will need to create a Twitter API account.
With the Twitter API account, you can create an application, and generate the tokens. For these tokens, you will need to copy to the .env file in the root of your folder GCP-BigQuery-Svensk-Politik. It has the following contents:
CONSUMER_KEY=
CONSUMER_SECRET=
ACCESS_TOKEN_KEY=
ACCESS_TOKEN_SECRET=
Now you can start testing your Twitter stream. In your terminal, run the following command from your GCP-BigQuery-Svensk-Politik folder:
$ node bin/www
Run the node app for a while. This will load new content into BigQuery. Now, look in your terminal. You should see the data based on your search terms streaming in.
To close the data stream hit
CTRL + c.
Machine Learning API
You have now started to collect data. How will you know that people are talking good or bad about a particular political party? Just counting all the tweets wouldn’t be the correct thing to do. We need to understand the context of the data.
For this, you can use machine learning. Machine learning is not only for data scientists and experts. You and I can make use of it as well.
The Google Cloud Platform provides many APIs that are easy to use. Google has several machine learning APIs:
- Speech API (which can convert speech to text)
- Vision API (which can get insights from pictures)
- Translate API (to translate text to a certain language)
- Video Intelligence API (to retrieve metadata from videos)
- Natural Language API (to derive insights from the unstructured text).
For our Twitter data, we will use the Natural Language API. Before using the Natural Language API, we would need to translate our Swedish tweets to English, as the GCP won’t understand the Swedish language.
What we will do is translate the Twitter text from Swedish to English, as we need to know if the context of the tweet is positive or negative. For this, we will make use of the Translate API to translate to English and then use the Natural Language API to find out if the tweet is positive or negative.
When we have the score from the Natural Language API, we will store the result in BigQuery with the original tweet and with a ranking total score column.
Go to the cloud console and click on the menu (hamburger) button.
Click API Manager > Dashboard and click Enable APIs.

Click Natural Language API from the Google Cloud Machine Learning API section. Click Enable. Go back to the previous screen, and select Translation API and hit Enable again.
Sentiment Score
A sentiment score is between -1.0 (negative sentiment) and 1.0 (positive sentiment). A magnitude is a non-negative number in the [0, +inf) range, which represents the absolute magnitude of sentiment regardless of score (positive or negative).
In the folder GCP-BigQuery-Svensk-Politik/lib/ml.js on your laptop, you can change the language in the file ml.js change the input parameter on line 11 to another language, such as es for Spanish or fr for French.
Feel free to play around with it, and pass in different text strings or language API settings.
From the terminal run:
$ node bin/www
You should see the Twitter lines streaming in, with translations and sentiment detection.
The next step will be to push these data into BigQuery!
BigQuery
BigQuery is a fast, economical and fully-managed enterprise data warehouse for large-scale data analytics. BigQuery can query terabytes of data in seconds and petabytes in minutes!
The code to save the data in BigQuery you find GCP-BigQuery-Svensk-Politik/lib/bigQuery.js
In the file GCP-BigQuery-Svensk-Politik/lib/twitter.js to bigQuery.js is required:
var bigquery = require( path.resolve( __dirname, "bigQuery.js" ) );
And within the most inner callback (on line 127), you can enable the insertBq() method:
bigquery.insertInBq(row);
Run the node app for a while. This will load new content into BigQuery.
When you have collected data for a while, you can access BigQuery, and look at the database, and you could run a bunch of queries to analyze your data. Click Compose Query, enter a query
SELECT SUM(score) as totalscore, party,
COUNT(party) as totalparties
FROM svenskpolitiktweets.svenskpolitik
GROUP BY party
ORDER BY totalscore DESC
and Click Run, to run the query. This query will sum the total sentiment score per political party. Also, it counts and it groups the Swedish political parties. You will see the results in the table below the new query.

When the results look ok to you, you can save the view. This will create a new view (which is like a table, but it includes the query). It contains a unique result set. We will need this later for Data Studio.
Let’s create a few more queries, to build a Dashboard in Data Studio.
The 3 most positive parties:
SELECT SUM(score) as totalscore,party
FROM svenskpolitiktweets.svenskpolitik
GROUP BY party
ORDER BY totalscore DESC
LIMIT 3
The total amount of tweets per party:
SELECT party,
COUNT(party) as totalparties
FROM svenskpolitiktweets.svenskpolitik
GROUP BY party
ORDER BY totalparties DESC
And the total amount of tweets:
SELECT COUNT(text) as totaltweets
FROM svenskpolitiktweets.svenskpolitik
In case you want to browse through all the tweets, you can use:
SELECT text, party, score
FROM svenskpolitiktweets.svenskpolitik
DATA STUDIO
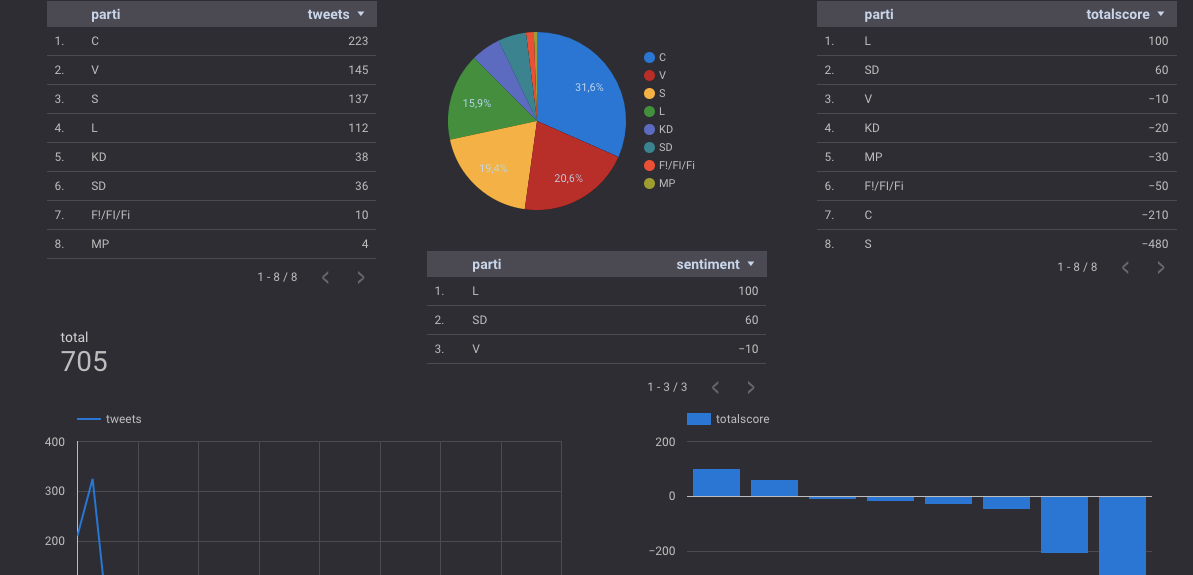
You can use these queries to build a friendly dashboard using Google Data Studio. This is what I got done.

If you want to build your dashboard, you can get started by creating a new report, dropping a chart onto the report and then you will need to create a new Data Source.
You can set it to BigQuery Connector. You select your project, your dataset, and then your table set or table views. From that moment, you can start using all your data within the Data Studio. You can easily refresh the data by clicking on the Refresh Data button:
With Google Data Studio, you can drag and drop charts, images and visualizations on the stage. It turns your data into informative dashboards and reports which are easy to read and share.
CONCLUSION
In this article, you have learned how to work with various Google Cloud services. Machine Learning APIs like the Natural Language API and Translation API to understand the data, BigQuery to analyze the data and Data Studio to visualize the data in nice charts.
Instead of running the Node.js app on your laptop, you could spin off a new virtual machine in GCP by using Cloud Launcher.
THE COSTS
My data wasn’t that big, so I didn’t have any costs for executing BigQuery queries. The API will cost you money over time if you provide a service that predicts sentiments. For my test example, it stayed within the limits of the Natural Language API call request tier.
BigQuery storage will cost $0.02 per GB Streaming data in BigQuery: $0.05 per GB (loading data is accessible). Executing Queries will cost you $5.00 per TB, but the first TB per month is free. BigQuery Pricing.
Note that Data Studio uses a BigQuery connector, which fires queries in BigQuery.
The price for translation and language detection is about 20 dollars for a million characters. It will become cheaper once your amount is over 1.5 billion characters. See Translate API pricing.
The Natural Language API has a free tier if the number of text records stays under 5k. For pricing info, see Natural Language Pricing.
Another great way to check and estimate costs is by using the GCP Pricing calculators.
If you are concerned about the prices, you can set up a billing alert. Which can send an email to you once you reach your quota? From the Cloud Console, you can enable this by clicking: Billing > Budgets & Alerts.

On this screen, you can select the project and your quota. – You can get emails once you get closer to your quota.
Thank you for reading, if you have questions or comments, you can make them below.

Tech Disillusionment
For four decades, I have worked in the tech industry. I started in the 1980s when computing...

A Poem: The Consultant's Message
On a Friday, cold and gray,
The message came, sharp as steel,
Not from those we...

Using AI to Plan Wall Repair and Gutter Installation
In this article, I will share my experience using AI to plan the work required to fix a wall...