Monitoring your WordPress site with New Relic
by bernt & torsten
What are you using to monitor your WordPress site? I’m using New Relic, I been using New Relic for a long time and like it, when my site goes down (happens sometimes) New Relic will send me a notification.
Not only notifications, but I can also set my own alerts notifications, so I can be warned we there is e.g. heave traffic to the site. You could set events that you are important to you.
There is a lot of information that you can get from monitoring in detail your site. Looking at my New Relic monitoring overview, my bottleneck on my server is PHP, I can overcome that with upgrading to PHP 7. Benchmarks of WordPress using PHP 7 are showing a 2-3 x speed improvement compared to PHP 5.6.
Upgrade to PHP 7 is a project I have planned for later this year.
Currently there is no php7 agent for the new relic, so if you want to monitor your WordPress site with New Relic, you should wait – the latest rumor is that the PHP 7 agent will be available in February 2016.
New Relic
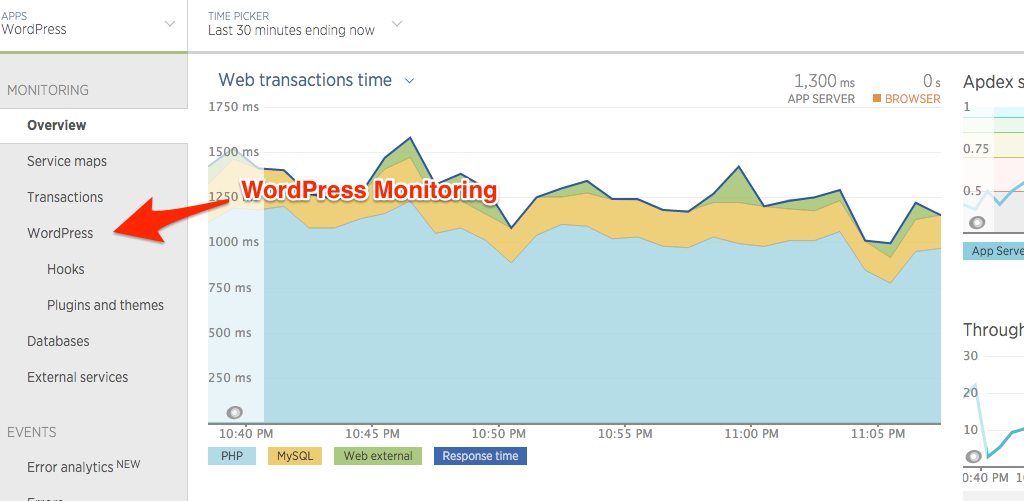
New Relic has added support for WordPress monitoring, this is a great option for monitoring your WordPress site.

Monitoring WordPress transaction times with New Relic, allows me to explore which plugin that takes the longest to load, what load time the theme takes.

This is a great help for me, I do not need to have a plugin or use other means to measure load time to find which plugin is causing an issue. It saves me time to focus on another task, it also gives me the opportunity to try out different plugins with similar functionality on my staging host before I choose one and add it to my production.
Monitoring the WordPress hooks, lets me get an insight into the inner working of WordPress, as you can see of the image below. Plugin loading is the most time-consuming task when loading WordPress.

The New Relic WordPress Monitoring has sped up my website, I have disabled plugins that I used occasionally e.g. backup (I enable the plugin when I make a backup). I also have to remove plugins that I used to troubleshoot my site with, especially plugins e.g. P3 Profiler that shows me the load time of plugins. I can do that now with New Relic WordPress Monitoring.
With monitoring WordPress Hooks/Plugins & Theme, I can sort the data that New Relic collects from my server, like:
- Most time-consuming
- Slowest average call time
- Function call time

I find the New Relic monitoring a great tool for monitoring my WordPress server, you should check it out.

Tech Disillusionment
For four decades, I have worked in the tech industry. I started in the 1980s when computing...

A Poem: The Consultant's Message
On a Friday, cold and gray,
The message came, sharp as steel,
Not from those we...

Using AI to Plan Wall Repair and Gutter Installation
In this article, I will share my experience using AI to plan the work required to fix a wall...