
How to Visualize your data on your website
by bernt & torsten
Have you ever wanted to visualize any of your data showing a bar graph, pie chart, word clouds, and other web visualization more than the text? There been an explosion in the number of available data sources and data-processing tools mean that more people than ever are jumping into the world of data visualization. But with so much to learn, it can be intimidating to know just where to start. I have been working with several visualization libraries to visualizes data for various web applications.
There is no library that fits all the needs, so which library fits best? Have a look at what libraries I been using for various projects I been working on.
Google Charts

I had a need to visualize a data set of a number of articles by countries on a Global Map by a specific timeframe, for that I choose to use the Google Charts Geomap – below is how it shows on the web page. I like Google charts as you can have different data sources, the work I recently did collect the data in a MySQL database, you can also use Google Sheets as your data source.
Word clouds
There are two libraries that I like to work with – available on GitHub – HTML5 Word Cloud and jQCloud – an example of some work


Highcharts
Highcharts is a charting library written in pure JavaScript, offering an easy way of adding interactive charts to your website or web application.
Here is an example of work – in this scenario, we have 3 different areas – area 1 is showing a pie chart that visualizing 5 elements – they are all interactive by clicking on an element in the pie chart values change. Area 2 is showing the timeline for specific campaigns, by changing campaign the value timeline value chance. Area 3 is showing the timeline for all items found during a selected time period.

Other libraries
There are some more libraries that I have tried out, which are worth mentioning.
Flot
Flot is a pure JavaScript plotting library for jQuery, with a focus on simple usage, attractive looks and interactive features.

Arbor.js
Arbor is a graph visualization library that provides an efficient, force-directed layout algorithm plus abstractions for graph organization and screen refresh handling.

D3.js
D3.js is a JavaScript library for manipulating documents based on data. It helps you bring data to life using HTML, SVG, and CSS.

jChartFX
jChartFX plugin gives you extra powers to develop full commercial dashboards and business intelligence applications.

dygraphs
dygraphs is a fast, flexible open source JavaScript charting library. It allows users to explore and interpret dense data sets.

Sigma
Sigma is a JavaScript library to graph drawing. It makes easy to publish networks on Web pages and allows developers to integrate network exploration in rich Web applications.

Selecting a library
The first thing to do before selecting a library to work with is understanding your dataset, what visualization you are going to do with that data. You might want to create a few charts in order to explore the scope, depth and ‘texture’ of the data and find interesting stories to highlight. It’s important to look at the format of your data and ask exactly what it is that you’re working with.
Are you interested in visualizing a time period? Is it categorical data? All of this might influence your decision. Certain libraries like D3 are generalists, which can work with a range of types of data. Others are more data-type specific. If you know from the beginning what it is that you’re working with, it’s important to choose the tool that works best with that data.
When you know what story you want to tell with the charts/graphs, you can select the library that fits you best and builds that into your web application.
Have a question make a comment use the box below.

Tech Disillusionment
For four decades, I have worked in the tech industry. I started in the 1980s when computing...

A Poem: The Consultant's Message
On a Friday, cold and gray,
The message came, sharp as steel,
Not from those we...
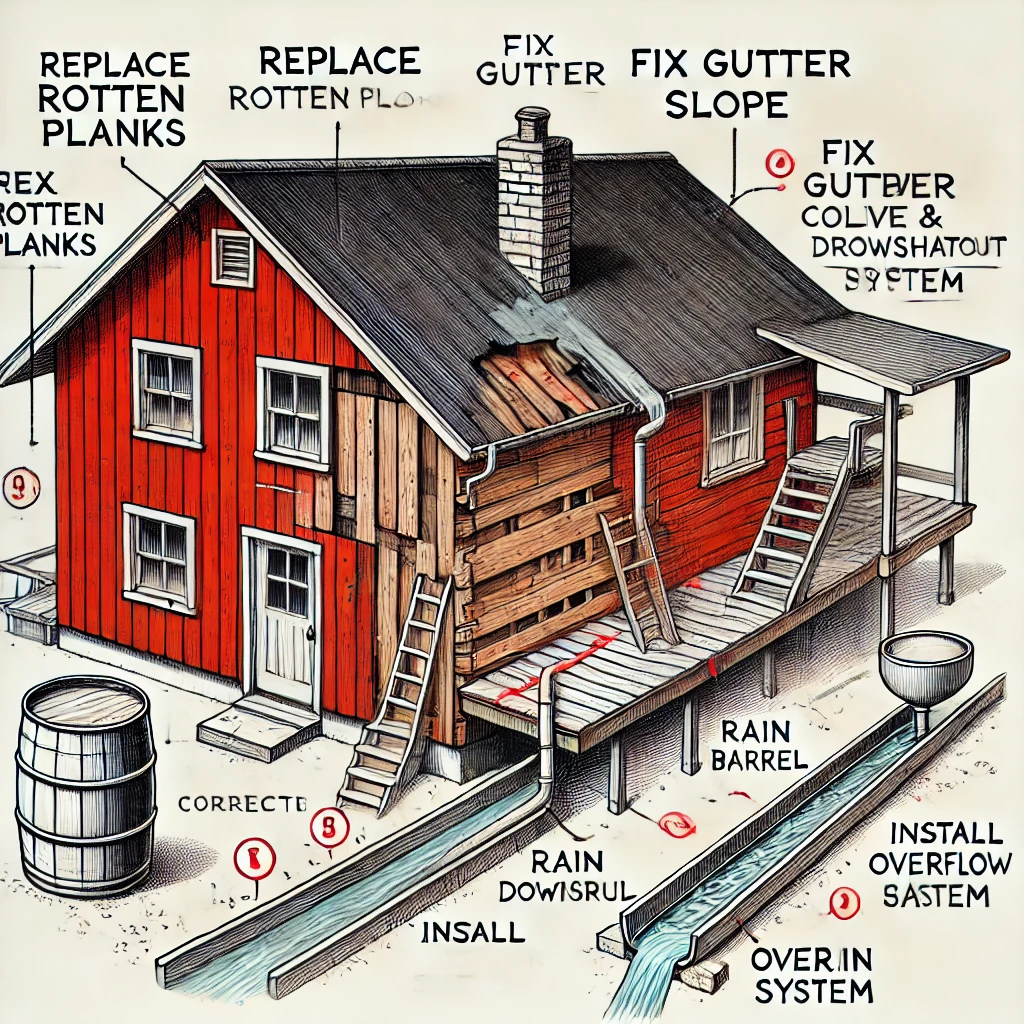
Using AI to Plan Wall Repair and Gutter Installation
In this article, I will share my experience using AI to plan the work required to fix a wall...