
#datapipeline the hourly electricity rate
by bernt & torsten
I spent my Christmas holiday in the southern part of Sweden, the weather was cold with several days of temperatures down under -10 celsius. In the news were stories about new price records for a KwH of electricity. I started to get worried that our electricity bill for December or for the whole winter period would become sky-high.
I start researching how electricity prices were set, In Sweden, people have seen the highest electricity prices ever in all of the four price areas since 2011, the year when Sweden was divided into four price areas.
The electricity price is basically determined by the electricity exchange for northern Europe – Nord Pool. Here, energy producers and electricity suppliers meet to find out what electricity will cost by the hour. This controls the electricity bills, but it will always be higher than Nord Pool’s so-called spot price.
There are a few websites that I can visit to get the current price, and I also can visit my electricity provider to get my consumption, the consumption is just an increasing bar on a chart, only at the end of the month I will get the total.
I which I could get a daily consumption level, there are some new electricity providers in the Swedish market that you can use an app to control the electricity usage in your house by installing a digital device with your smart meter, one of the most ambitious digital electricity providers are Tibber.
Building my own electricty data pipeline
As it is not really a good time price-wise to switch electricity providers, I decide to build my own electricity data pipeline to get the latest prices so I can control my electricity consumption by not using my appliances when the electricity price is high. This is the architecture that I created that generates a report that is emailed daily to my family members.

Cloud Scheduler
The Cloud Scheduler is the “alarm clock” of the data pipeline, the Cloud Scheduler wakes up once a day 10 minutes past midnight, to kick off the cloud function job. It runs for about 1 minute before the whole steps in the data pipeline are completed.
Cloud Function ETL
I use a Cloud Function to do my ETL – all the ETL steps are done in the Cloud Function, an ETL pipeline consists of three general components:
Extract – This is my data collection step. I use two techniques to extract data for my pipeline, the first technique is that I extract a web page with pricing data and then find the data elements in the web page HTML that holds the data, this is called web scraping.
The other technique I use is to request data with a weather API get request. This technique will give predefined data elements, in this case, weather data.
Transform – When I have the data I need to transform it. For the pricing data I first have to clean it, and then structure it in a list. The weather data is already structured so I do not need to take any action. I use the two data lists price and weather to mesh it together, I have to transform the data into a record for the databases I use.
Load – When I have the database records I load the data to in this case BigQuery the data warehouse I use, and the source for my reporting, I also write the record to Firestore for use by a mobile app
Data Warehouse BigQuery
I store all the daily data collection in the BigQuery Data Warehouse, with that I then have access to the data from Data Studio so I can do the reporting.
Mobile Backend Database Firestore
I also store the data in Firestore, this is to make the data available in my personal web app, yes I could probably query BigQuery for the data, I have other data pipelines that collect target new data, website statistics, etc, now I added the electricity data, and my main reason for Firestore is that I want all my data collections to be in the same database for my web app.
Reporting Data Studio
I use Data Studio for my reporting, Data Studio gives me many advantages the biggest to me is that it is easy to use, connects to many different data sources and has automatic notification by email. This saves me time on getting a report that can be used by my family and every morning my family gets an email with the daily report so they know the cost implication of using the electricity at certain times in the day.
Data Studio Overview Page
The overview page gives a snapshot of the daily price difference by the hour and the temperature difference during the same period. I also include a map to show which location the data is for, the expected max and min temperature for the day, the max and min price for the day and the average price for the day.
I also include wind speed and UV factor, the windspeed is for the purpose of knowing the wind strength, one factor is that wind farms produce electricity, and when the price goes up the excuse for the price increase is often that it was not windy enough to produce enough electricity.

Montly view
The monthly view is simply just showing the price and temperature for the current month.

Appliances View
I added an additional data source, which is Google Sheet where I have a list of my appliances that uses electricity, what it will cost to run each electrical appliance in a regular month, and what Co2 impact the electrical appliances has on the environment. This is still a work in progress as I want to use the actual cost per month to calculate the electricity cost of running appliances


Tech Disillusionment
For four decades, I have worked in the tech industry. I started in the 1980s when computing...

A Poem: The Consultant's Message
On a Friday, cold and gray,
The message came, sharp as steel,
Not from those we...
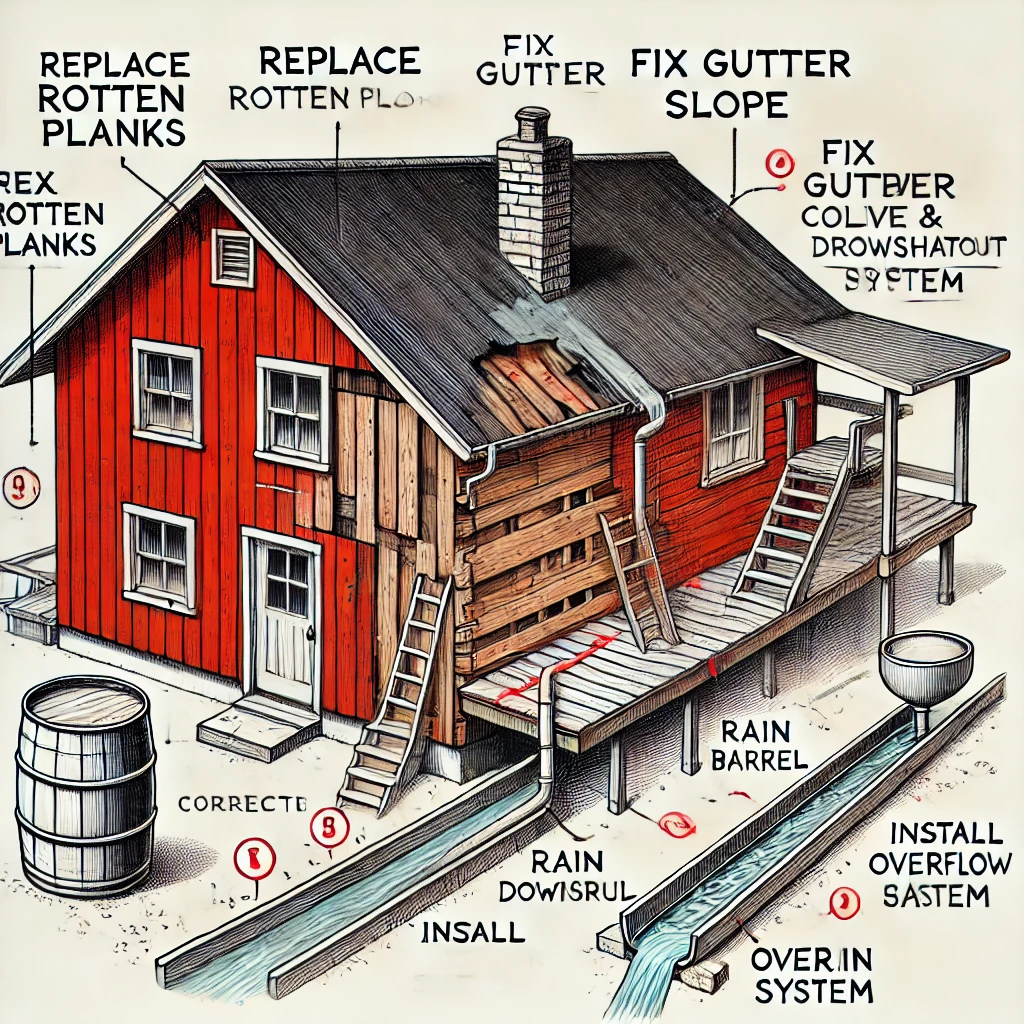
Using AI to Plan Wall Repair and Gutter Installation
In this article, I will share my experience using AI to plan the work required to fix a wall...