
Data project: I became an environmental data collector
by bernt & torsten
At the beginning of the Corona epidemic, I wrote an article about a personal data project I had worked on: The air I breathe how polluted is it?. After that project, I became an environmental data collector by purchasing a wearable, portable indoor-outdoor air quality monitor. My interest in air quality is about the fact that I have asthma and I need to take precautions where ever I go and try to avoid places that could trigger my asthma.
In that article, The air I breathe how polluted is it? I mention that I wanted to measure my in-house pollution and collect data to do some analysis and write up an article on those findings. This article is not exactly about indoor pollution, even if it is included in the dataset I have collected – I did not separate out indoor and outdoor data in my dataset.
To collect the data I did some research and decide to invest in an Atmotube PRO wearable, portable indoor-outdoor air quality monitor. The Atmotube PRO detects PM1, PM2.5, and PM10 pollutants, like dust, pollen, soot, and mould, plus a wide range of Volatile Organic Compounds (VOCs).

Atomtube collects the data in real-time and updates the Atmotube mobile app, which is giving you updates about the air quality. You can collect data from your most visited locations: home, work, running or cycling route. You can get an answer if the air is safe to you in these places, if not the app will notify you if the air pollution is bad?

Collecting Data
In the Atmotube mobile app, there is an option to save the data collected data to a .csv file, after you save the file you can upload the file to your laptop, in my case I uploaded it to Google Drive with the Google Drive App.
In this article Splitting addresses with Google Dataprep, I explain what steps I took to clean data before I created the analysis and plotting of the data I collected.
Data Studio Report
I created a BigQuery dataset from the Atmotube data, this allowed me to make a Dashboard in Data Studio, here is a screenshot.

Python Notebook
For plotting and mapping, I created a Python Notebook, that you can view below.
Conclusion
This was a fun project as I touched many data sciences steps by collecting the data, cleaning and enhancing the data and then finally analyzing and presenting the data. If you have any comments do let me know.

Tech Disillusionment
For four decades, I have worked in the tech industry. I started in the 1980s when computing...
A Poem: The Consultant's Message
On a Friday, cold and gray,
The message came, sharp as steel,
Not from those we...
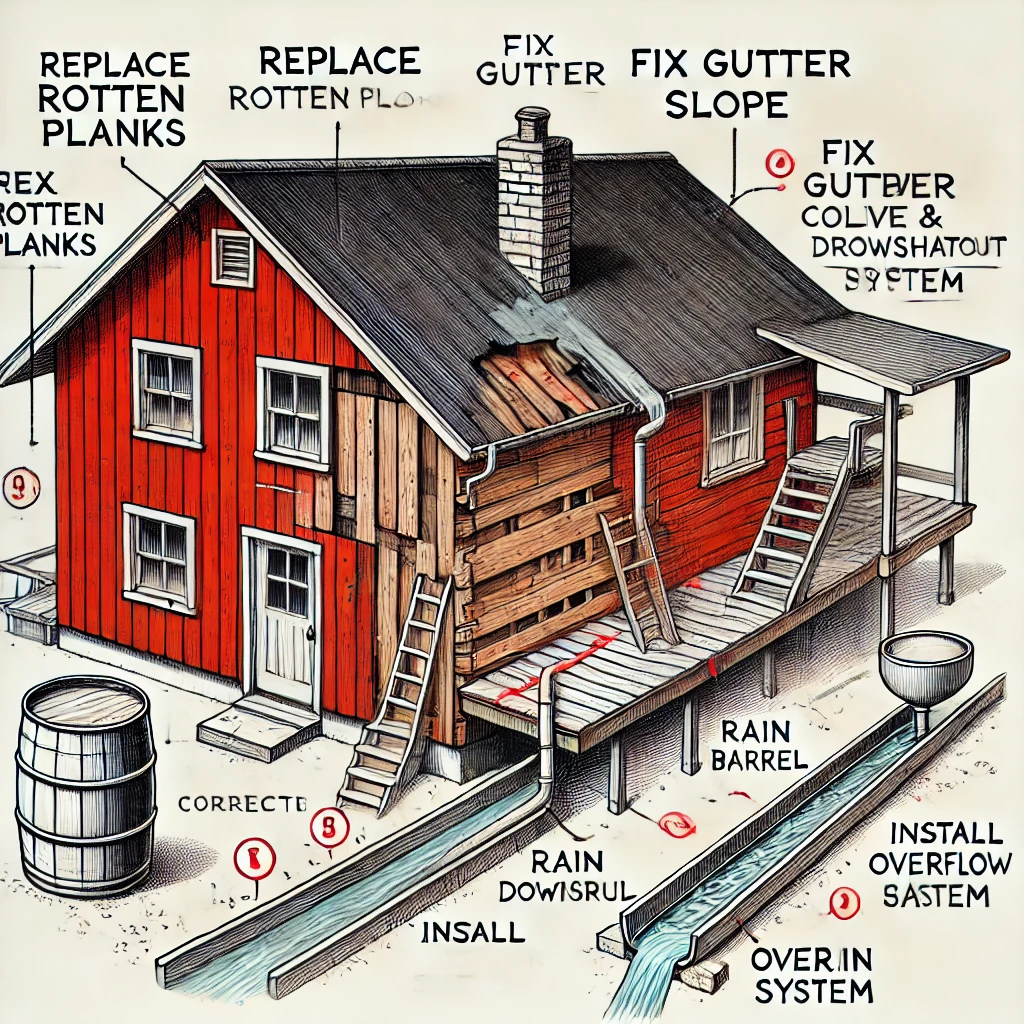
Using AI to Plan Wall Repair and Gutter Installation
In this article, I will share my experience using AI to plan the work required to fix a wall...